This is a step-by-step tutorial to build a fully self-hosted home climate monitoring system with cheap components, that sends a daily email with a floorplan heatmap. We’ll cover everything from soldering to writing MicroPython, making a Prometheus exporter, getting things visualized in Grafana and deploying a runnable container to email the snapshots of the heatmap. Project code is available here.
Part 1: shopping list
Per-pico: £25
| Item | Purpose | Cost |
|---|---|---|
| Pi Pico W | Motherboard (‘W’ is the Wi-Fi enabled Pico) | £7 |
| DHT22 sensor | Cheap, easy way to get temp/humidity readings with good accuracy | £7 |
| Soil moisture sensor (capacitive) | To measure moisture of soil (e.g. for a plant pot) | £6 |
| Micro-B USB PSU | The “charger” | £4 |
| Blue LED | Used to locate a sensor with bright blue flashes – 20 mA, 3.2 V is ideal | 20p |
| (optional) LED lens | Shines the blue LED better | £1 |
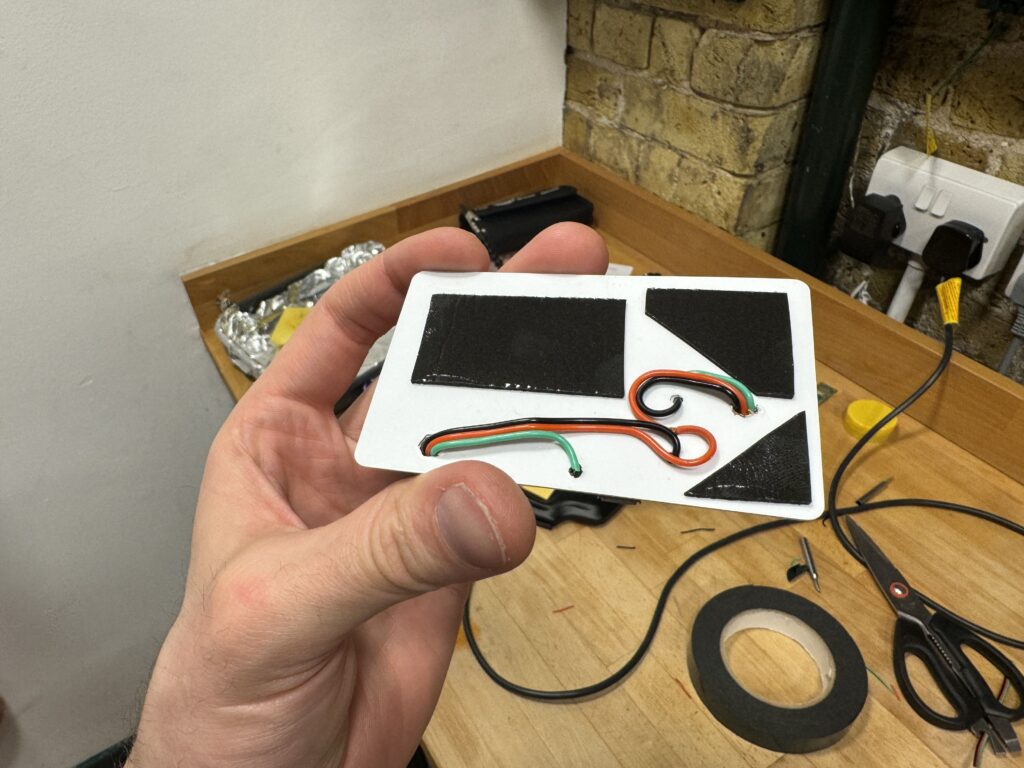
| 2x blank ID cards | Buy these in bulk | 40p |
Once-off: £58
| Item | Purpose | Cost |
|---|---|---|
| Pi Pico WH | The ‘H’ in WH means it has headers, so you can connect it to a breadboard for prototyping | £7 |
| DHT22 sensor | Cheap, easy way to get temp/humidity readings with great accuracy (0.1°C / 0.1% RH) | £7 |
| Breadboard | For prototyping | 80p |
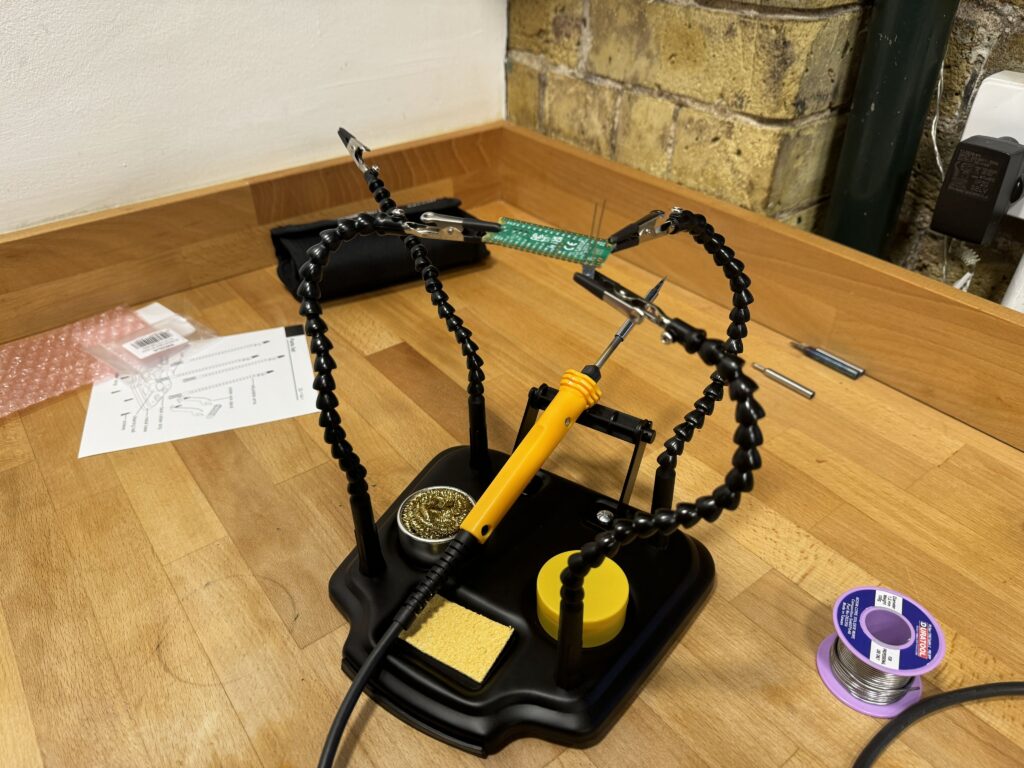
| Antex soldering iron | Soldering the production boards. Antex irons have a very flexible cord which helps. I got a 30W one which worked okay. | £21 |
| Third hand tool | I absolutely recommend this tool; I bought one from Duratool with 4 arms that allowed me to grip the Pico and wires in place whilst soldering both together. | £15 |
| Rosin solder | Solder | £7 |
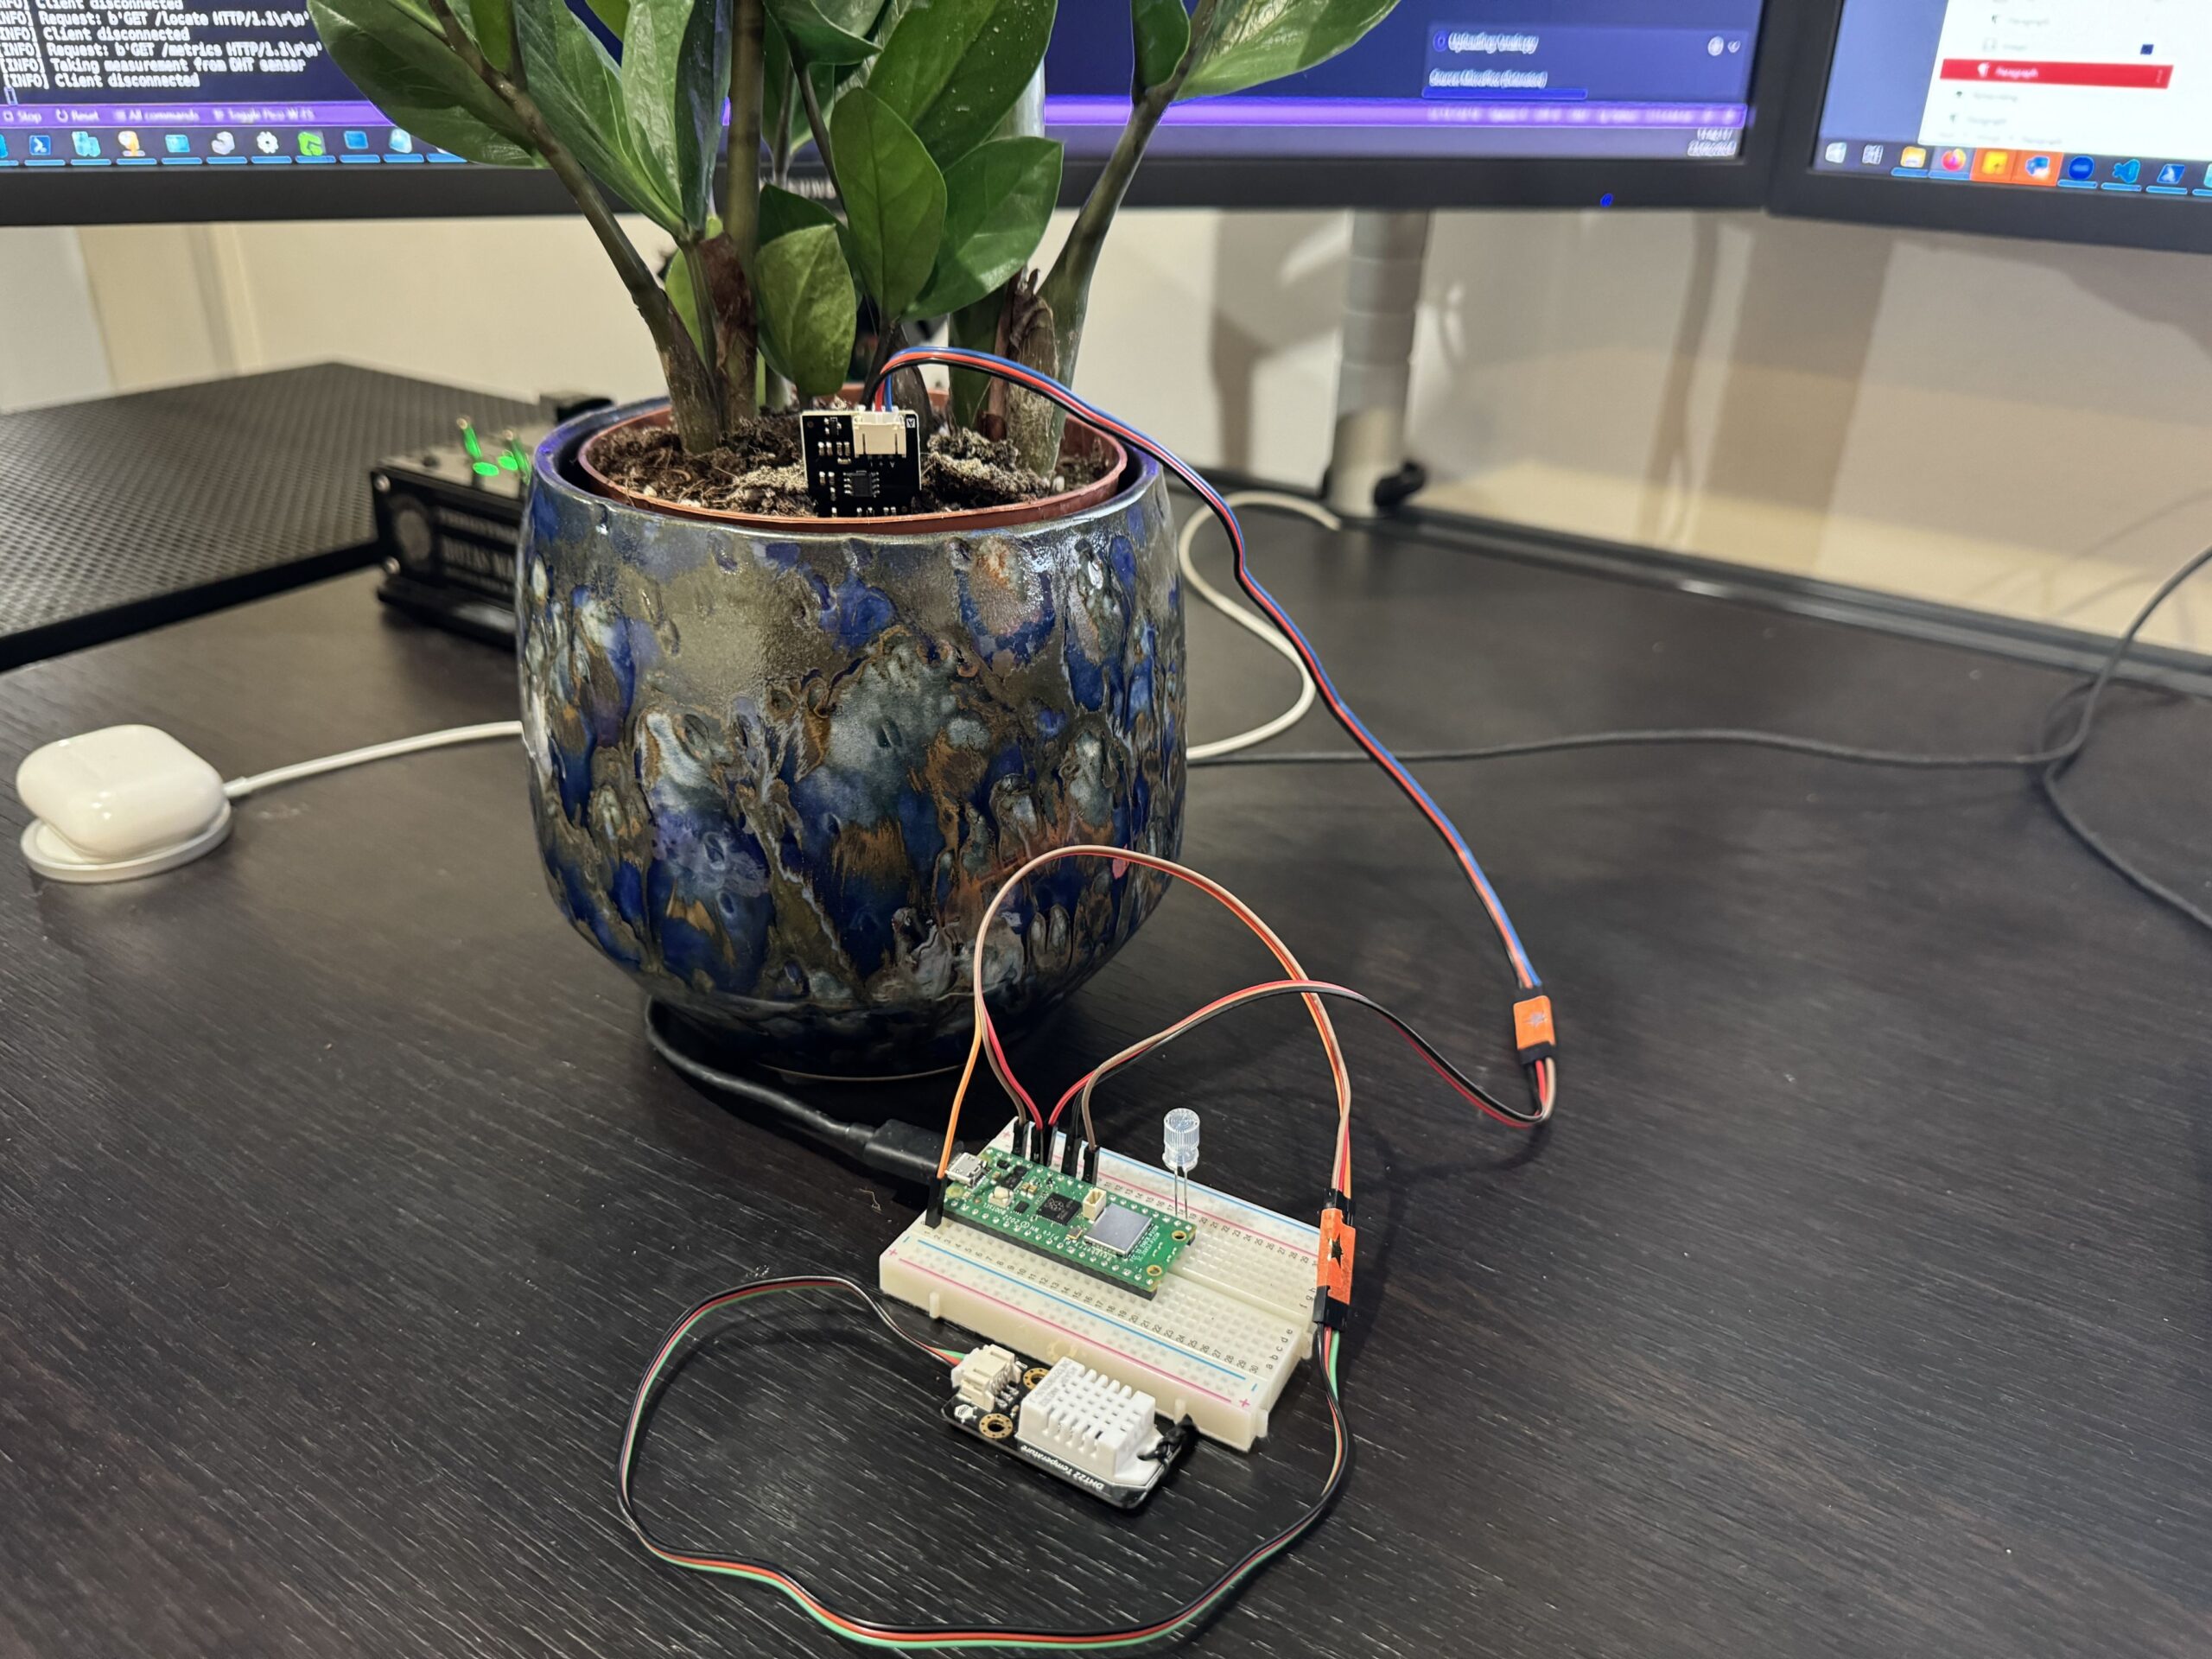
Part 2: building the first prototype
Definitely start with a breadboard unit first. I provide instructions and pinouts in the next step, but I’ll first explain the basics of reading data with a Pi Pico.

To get started, use the MicroPico extension from paullober in VS Code. Plug in your Pico and wait until you see Pico Connected:

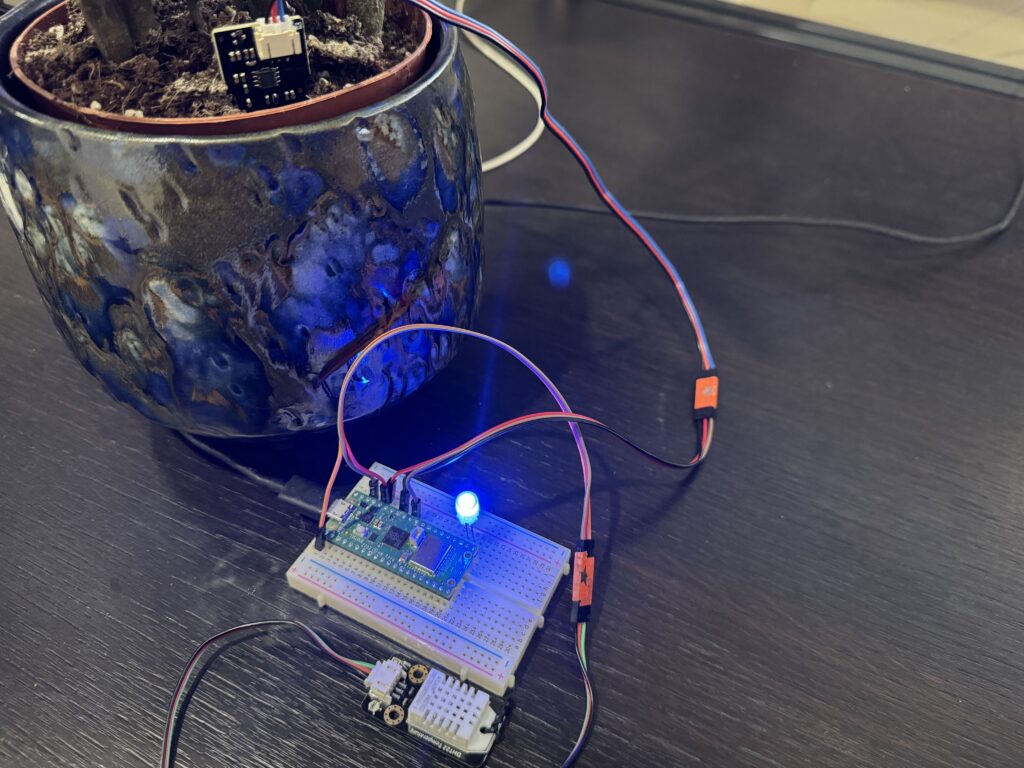
Plug a DHT22 into the Pico:
- green (data) wire in Pin 1 (aka
GP0– general purpose 0) - red (power) into Pin 36 (aka
3V3(OUT)) - black (ground) into any
GNDpin (eg Pin 38)
Now let’s take a temp and humidity sample every 3 seconds:
from machine import Pin, ADC
from dht import DHT22
from utime import sleep

sensor = DHT22(Pin(0))

while(True):
    sensor.measure()
    temperature = sensor.temperature()
    humidity = sensor.humidity()

    print(f"Temperature:\t{temperature:.2f} *C")
    print(f"Humidity:\t{humidity:.2f} %RH")
    print("")
    sleep(3)
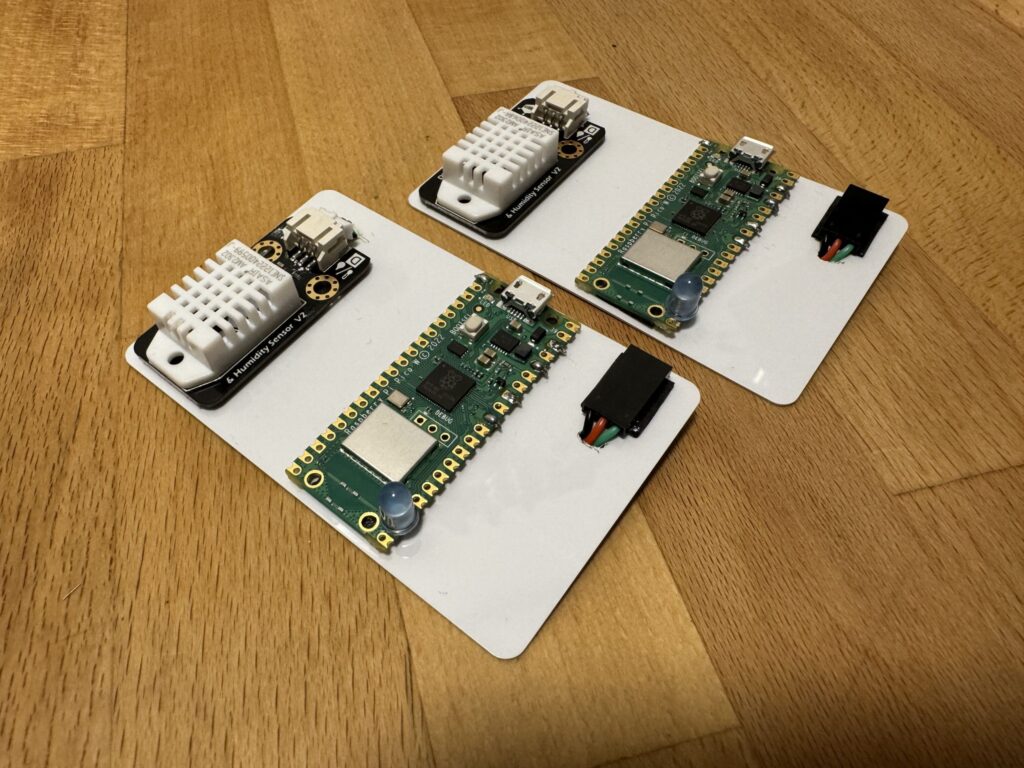
Part 3: soldering production units
⚠ Danger: wear eye protection and gloves.
Warning: do not solder too long, else you can ruin your board.
Warning: it’s very hard to unsolder joints. For pin 36, TWO wires are soldered into the same pin hole. Twist them together very tightly first and snip off any coarse tips before feeding it in.
Note: pins holes start from 1 to 20 (left side going down, facing up), the 21 to 40 (right side going up). For example, GP17 is actually physical hole 21.
- Prepare the soldering station: wet sponge, and steel wire are important.
- Cut the DHT22 probe’s cable in half, leaving about 10cm+ on each half. We’ll use the side with three female DuPont connectors to make an optional terminal if we want to plug in a soil moisture sensor later.
- Warm up the soldering iron for about 5 minutes.
- Pierce some holes through the plastic by holes 1, 31, 33, 36 and 38 (tip: mark them with a fineliner pen through the Pico when pressed against the plastic to mark the locations.
- Pierce two larger holes through where you want to feed the DHT22 and optional soil sensor terminal through.
- Flip the Pico upside down and place the short leg of the blue LED in hole 23 (GND), and long leg in hole 22 (GP17) – we’re going to solder this from the underside so the LED will be flush with the Pico. Solder it on.
- Take the black wire of the DHT22 sensor and cut off some plastic, exposing the core – twist it a few times and feed it through hole 38 (GND) and solder it on. You can actually use any GND you like.
- Solder the green wire from the DHT22 sensor into hole 1 (GP0)
- Leave the red for now (we need to intertwine it with the soil terminal’s 3V3 (red) wire.
- Solder the green wire from the soil moisture terminal into hole 31 (ADC0 a.k.a. GP26). This cable is just the other half of the original cable that we cut off in Step 2.
- Intertwine both remaining red wires very tightly together and feed through hole 36 (3V3(OUT)). Take care that no loose strands touch (“short circuit”) with the rest of the board. You only get one chance to solder this, so check now.
- Solder the two red wires.
- Trim off loose ends from all the soldered wires on the board, leaving a clean finish.
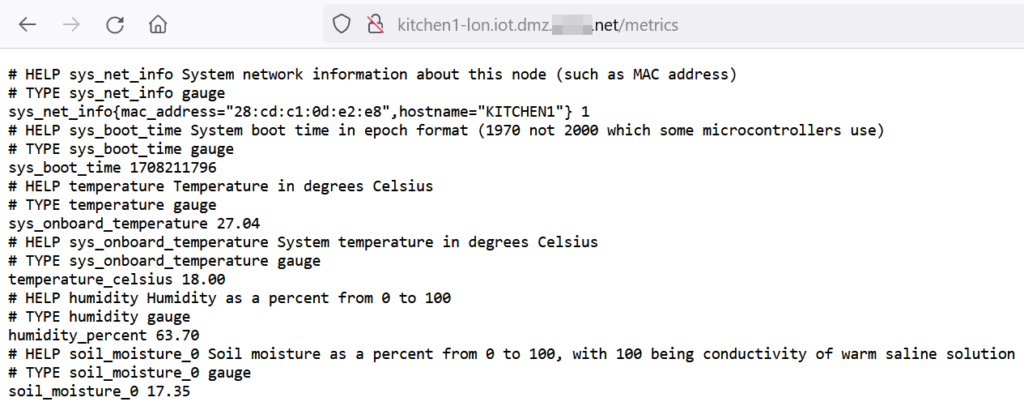
Part 4: writing environment_exporter to expose metrics
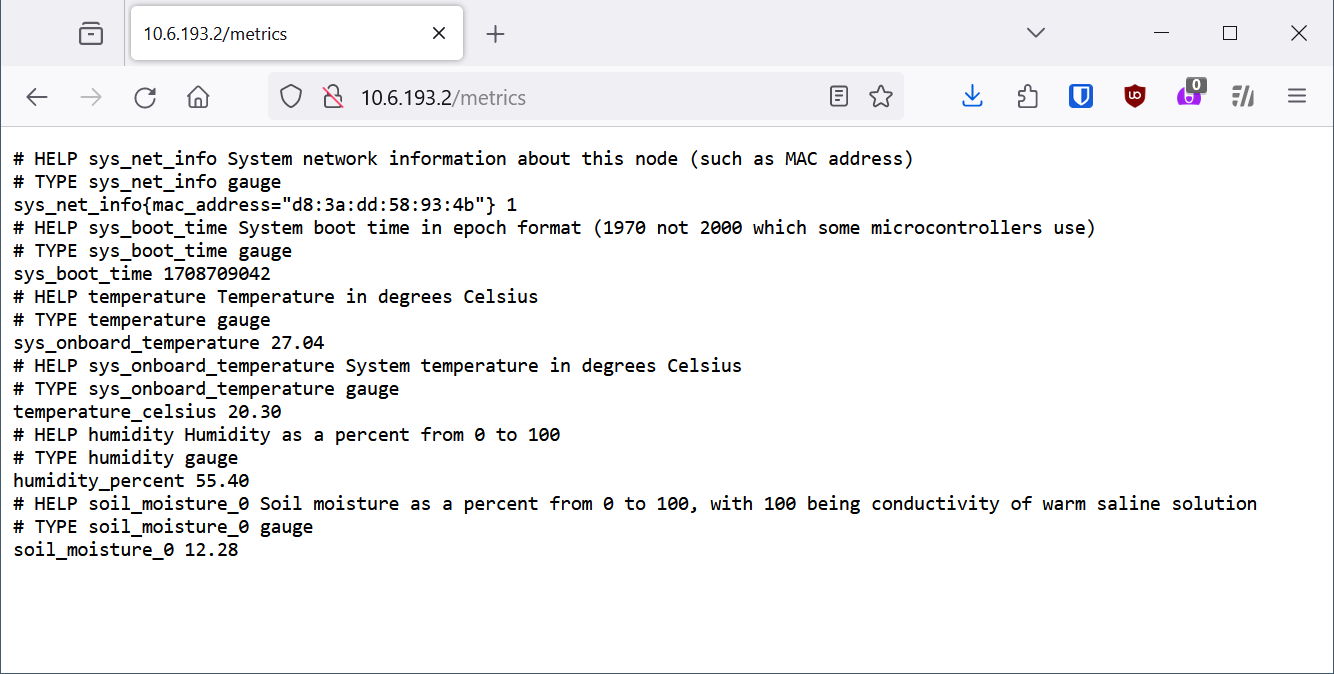
There is nothing special about Prometheus exporters. They’re just text/plain output on a page normally accessible at http://<hostname>:<port>/metrics. We’ll use port 80, so it’s implicit.
HELP and TYPE comments above are parsed by systems like Grafana, but are optional. We’ll write a small web server that spits out data at /metrics for Prom to scrape. We have two files – one of them is the main server (called main.py) and the other is a template for formatting the data (called template.py). Let’s start with the template file as that’s easier.
# Templates
METRICS = """\
# HELP sys_net_info System network information about this node (such as MAC address)
# TYPE sys_net_info gauge
{sys_net_info}
# HELP sys_boot_time System boot time in epoch format (1970 not 2000 which some microcontrollers use)
# TYPE sys_boot_time gauge
{sys_boot_time}
# HELP temperature Temperature in degrees Celsius
# TYPE temperature gauge
{sys_onboard_temperature}
# HELP sys_onboard_temperature System temperature in degrees Celsius
# TYPE sys_onboard_temperature gauge
{temperature}
# HELP humidity Humidity as a percent from 0 to 100
# TYPE humidity gauge
{humidity}
# HELP soil_moisture_0 Soil moisture as a percent from 0 to 100, with 100 being conductivity of warm saline solution
# TYPE soil_moisture_0 gauge
{soil_moisture_0}"""

ROOT = """\
<html>
<head><title>environment_exporter</title></head>
<body>
<h1>environment_exporter</h1>
<p><a href="/metrics">Metrics</a></p>
<p><a href="/locate">Locate device</a></p>
<p><i>Andrew Taylor, 2024</i></p>
</body>
</html>
"""

LOCATE_STOPPED = "LED locating stopped"

LOCATE_STARTED = "LED will flash brightly until this web page is reloaded"Now for the main environment_exporter server. You need to change some of the settings at the top, such as your Wi-Fi name (IoT) and password (XXXXXXXX). Otherwise, it’s copy-paste-able.
import sys
import _thread
import utime
from utime import sleep
import uasyncio
from network import WLAN, STA_IF
from machine import Pin, ADC
from dht import DHT22
from ntptime import settime
from ubinascii import hexlify
import template

# Constants - user-changeable
SSID = "IoT"
PASSWORD = "XXXXXXXX"
LED_LOCATE_PULSES_PER_SECOND = 20 # How many pulses per sec the blue LED flashes when locating
# Ends

DHT_DATA_PIN = 0 # Physical pin 1
LED_STATUS_PIN = Pin("LED") # This means the onboard LED
LED_LOCATE_PIN = Pin(17, Pin.OUT)
DHT22_SENSOR = DHT22(Pin(DHT_DATA_PIN))
CAPACITIVE_PROBE_TYPICAL_MAX_DRY = 27000
CAPACITIVE_PROBE_TYPICAL_MAX_WET = 12000
BOOT_TIME = (
    None  # this is set once with a time from NTP, used to calculate uptime in Grafana
)
locate_flag = False
wlan = WLAN(STA_IF)


def locate_worker() -> None:
    '''
    Trigger the blue locate LED to flash rapidly every 50ms

    Returns:
        None
    '''
    global locate_flag
    global LED_LOCATE_PIN

    led = LED_LOCATE_PIN
    delay = 1/LED_LOCATE_PULSES_PER_SECOND
    while True:
        if locate_flag:
            led.on()
            sleep(delay)
            led.off()
            sleep(delay)
        else:
            led.off()
            sys.exit()


def set_ntp_time() -> None:
    '''
    Set time precisely on the device so uptime can be accurately reported. Uses default NTP servers.

    Returns:
        None
    '''
    settime()


def set_boot_time() -> None:
    '''
    Set boot time variable from current time

    Returns:
        None
    '''
    global BOOT_TIME
    BOOT_TIME = utime.time()


def network_init() -> None:
    '''
    Initialise the network (join Wi-Fi)

    Returns:
        None
    '''
    global mac_address
    wlan.active(True)
    wlan.connect(SSID, PASSWORD)

    max_wait = 10
    while max_wait > 0:
        if wlan.status() < 0 or wlan.status() >= 3:
            break
        max_wait -= 1
        print("[INFO] Waiting for connection")
        sleep(1)

    if wlan.status() != 3:
        raise RuntimeError("[ERROR] Network connection failed")

    print("[INFO] Connected")
    status = wlan.ifconfig()
    print("[INFO] IP: " + status[0])

    # Save MAC  address for sysinfo metrics
    mac_address = hexlify(wlan.config("mac"), ":").decode()


def measure_dht22(sensor: DHT22) -> None:
    '''
    Take a DHT22 reading

    Args:
        sensor (DHT22): An instance of a DHT22 sensor class

    Returns:
        None: The reading is kept within the class object
    '''
    print("[INFO] Taking measurement from DHT sensor")
    LED_STATUS_PIN.on()
    try:
        sensor.measure()
    except Exception as e:
        print("[ERRR] DHT22 reading was not captured")
        print(e)
    LED_STATUS_PIN.off()


async def get_sys_onboard_temperature() -> str:
    '''
    Return a string showing the onboard temperature measured on the board
    (not related to the DHT22's reading)
    The maths below is documented in the RP2040 data sheet
    https://datasheets.raspberrypi.com/rp2040/rp2040-datasheet.pdf

    Returns:
        str: A string of temperature in degrees celsius from the board's in-built sensor
    '''
    onboard_adc_pin = 4
    onboard_sensor = ADC(onboard_adc_pin)
    adc_value = onboard_sensor.read_u16()
    volt = (3.3 / 65535) * adc_value
    temperature = 27 - (volt - 0.706) / 0.001721
    return f"sys_onboard_temperature {temperature:.2f}"


async def get_sys_net_info() -> str:
    '''
    Get network inforamtion (MAC address).

    Returns:
        str: A string representation of the Pi Pico's MAC address.
    '''
    global mac_address
    return f'sys_net_info{{mac_adress="{mac_address}"}} 1' # Add '1' on the end as it's a gauge


async def get_sys_boot_time() -> str:
    '''
    Get system boot time.

    Returns:
        str: A string representation of the boot time since the Unix epoch.
    '''
    return f"sys_BOOT_TIME {BOOT_TIME:.d}"


async def get_temperature(sensor: DHT22) -> str:
    '''
    Get the temperature from a DHT22 object.
    It is essential to call measure_dht22 before using this function.

    Args:
        sensor: A DHT22 object representing the sensor to read from.

    Returns:
        str: A string representation of the measured temperature in degrees celsius.
    '''
    temperature = DHT22_SENSOR.temperature()
    return f"temperature_celsius {temperature:.2f}"


async def get_humidity(sensor: DHT22) -> str:
    '''
    Get the relative humidity from a DHT22 object.
    It is essential to call measure_dht22 before using this function.

    Args:
        sensor: A DHT22 object representing the sensor to read from.

    Returns:
        str: A string representation of the measured relative humidity in percent (0 to 100)
    '''
    humidity = DHT22_SENSOR.humidity()
    return f"humidity_percent {humidity:.2f}"


def clamp(n, min_n, max_n) -> float:
    '''
    Bound a number in a range e.g. -0.01 bound between 0 and 1 is returned as 0
    Used for analog sampling when a probe is calibrated to dryness and salt water

    Args:
        n (numeric): The value to clamp.
        min_n (numeric): The minimum value of the range.
        max_n (numeric): The maximum value of the range.

    Returns:
        numeric: The clamped float
    '''
    return max(min(max_n, n), min_n)

async def get_soil_moisture(adc: int) -> str:
    '''
    Get the soil moisture for a DFRobot SEN0114 corrosive probe

    Returns:
        str: the soil moisture
    '''
    if adc == 0:
        gpio_pin = 26
    else:
        raise ValueError("Invalid ADC pin. Only pin 0 is allowed.")

    analog_value = ADC(gpio_pin)
    reading = analog_value.read_u16()
    percent_unclamped = (CAPACITIVE_PROBE_TYPICAL_MAX_DRY - reading)/CAPACITIVE_PROBE_TYPICAL_MAX_WET
    percent = clamp(percent_unclamped, 0, 1) * 100 # no negative percents or percents over 100%

    sensor_id_string = "soil_moisture_" + str(adc)
    return sensor_id_string + f" {percent:.2f}"


def locate() -> str:
    '''
    Return a string whether the LED is locating or not

    1. the /locate endpoint is called, calling locate()
    2. if locate_flag is False (default), the `else` condition is reached and
        - a new thread is started to run the LED blink
        - a message to say locating has now started is set to be returned
    3. if locate_flag is True, the `if` condition is reached and
        - a message to say locating has now stopped is set to be returned
        - the concurrent thread will be checking every iteration if the flag has changed,
          and will then exit itself
    4. the locate_flag is flipped
    5. the response string is returned

    All this trouble is so the blue LED blink doesn't block out when /metrics is being called in parallel

    Returns:
        string: a string whether the LED is locating or not
    '''
    global locate_flag
    if locate_flag:
        response = template.LOCATE_STOPPED
    else:
        response = template.LOCATE_STARTED
        _thread.start_new_thread(locate_worker, ())
    locate_flag ^= True  # toggle the variable
    return response


async def handle_metrics_request() -> None:
    '''
    Handle the frequent call for metrics at /metrics

    Returns:
        None
    '''
    global DHT22_SENSOR
    global response

    sys_net_info = await get_sys_net_info()
    sys_boot_time = await get_sys_boot_time()
    sys_onboard_temperature = await get_sys_onboard_temperature()
    temperature = await get_temperature(DHT22_SENSOR)
    humidity = await get_humidity(DHT22_SENSOR)
    soil_moisture_0 = await get_soil_moisture(adc=0)

    response = template.METRICS.format(
        sys_net_info=sys_net_info,
        sys_boot_time=sys_boot_time,
        sys_onboard_temperature=sys_onboard_temperature,
        temperature=temperature,
        humidity=humidity,
        soil_moisture_0=soil_moisture_0
    )


async def serve_client(reader, writer) -> None:
    '''
    uasyncio (like asyncio) program that

    Args:
        reader: StreamReader instance
        writer: StreamWriter instance

    Returns:
        None
    '''
    global DHT22_SENSOR
    global wlan
    global response
    global response_template_root
    request_line = await reader.readline()
    print("[INFO] Request:", request_line)

    # Skip HTTP headers
    while await reader.readline() != b"\r\n":
        pass

    if request_line.startswith("GET /metrics HTTP"):
        status = "HTTP/1.0 200 OK\r\nContent-type: text/plain\r\n\r\n"
        measure_dht22(DHT22_SENSOR)
        await handle_metrics_request()
    elif request_line.startswith("GET / HTTP"):
        status = "HTTP/1.0 200 OK\r\nContent-type: text/html\r\n\r\n"
        response = template.ROOT
    elif request_line.startswith("GET /locate HTTP"):
        status = "HTTP/1.0 200 OK\r\nContent-type: text/plain\r\n\r\n"
        response = locate()
    else:
        status = "HTTP/1.0 404 OK\r\nContent-type: text/plain\r\n\r\n"
        response = "Endpoint not found"

    writer.write(status)
    writer.write(response)

    await writer.drain()
    await writer.wait_closed()
    print("[INFO] Client disconnected")


async def create_server() -> None:
    '''
    Creates and starts a web server with uasyncio

    Returns:
        None
    '''
    uasyncio.create_task(uasyncio.start_server(serve_client, "0.0.0.0", 80))


async def main() -> None:
    '''
    Entry point for program

    Returns:
        None
    '''
    print("[INFO] Connecting to network")
    network_init()

    print("[INFO] Setting time via NTP")
    set_ntp_time()

    print("[INFO] Setting boot time")
    set_boot_time()

    print("[INFO] Creating Prometheus exporter")
    await create_server()

    # Main loop that never yields
    while True:
        await uasyncio.sleep_ms(25)


uasyncio.run(main())
(We will address the screenshot and email functionality in a separate Python script later, unrelated to this.)
Testing
Now, right click any of your files in VS Code and click Upload project to Pico. Then, in the bottom next to Pico Conencted, click the Run button. You should see it tell you the IP address it got.
[INFO] Connecting to network
[INFO] Connected
[INFO] IP: 10.6.193.2
[INFO] Setting time via NTP
[INFO] Setting boot time
[INFO] Creating Prometheus exporter
[INFO] Request: b'GET /metrics HTTP/1.1\r\n'
[INFO] Taking measurement from DHT sensor
[INFO] Client disconnectedGo ahead and visit that IP. You should see the following page:
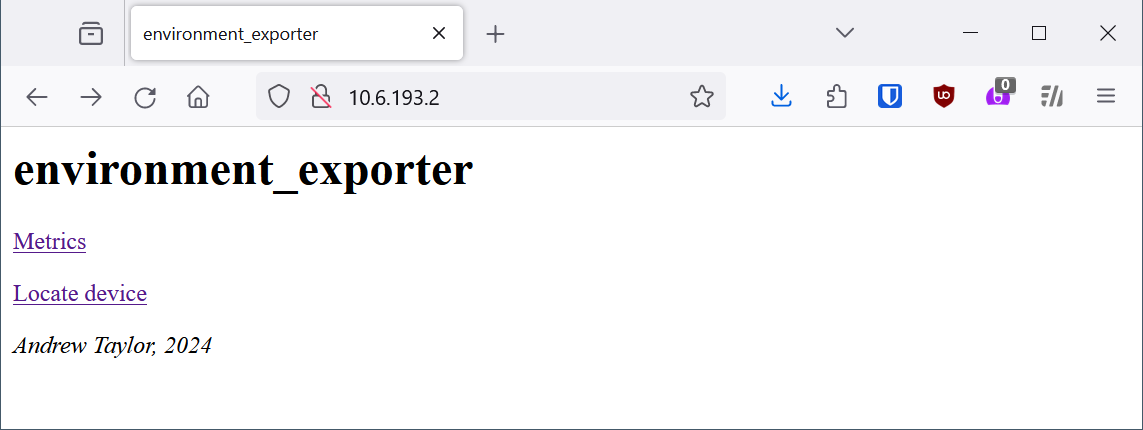
Click on Metrics to view metrics. You should clearly see Prometheus-style metrics.
Try Locate device to toggle the bright blue flashing LED.
Part 5: Networking
TLDR: do whatever you want for networking – everyone’s home network is different… you’ll need to add IPs or hostnames to a Prometheus file at some point.
I wanted a way for Grafana alerts to show the instance name as something useful, not just an IP. So, I needed a hostname in there. You can either achieve this by
- manually setting DNS records up and using DHCP reservations, or
- by enabling dynamic updates for clients (Picos) based on their MAC addresses and setting their hostnames once
I did Option 2 with a special separate DNS zone called iot.dmz.example.net which is served by an “IoT” VLAN on my pfSense firewall:
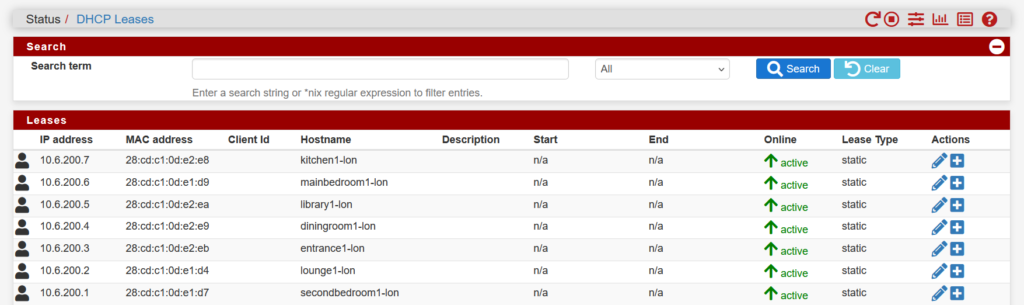
All of those hostnames will resolve if you ask any DNS server in my network for a FQDN, like kitchen1-lon.iot.dmz.example.net. My Grafana box’s default DNS server is a Windows Server DC, which has a forwarder for iot.dmz.example.net to go ask the pfSense. This is just one of many possible solutions here.
Part 6: Prometheus server config
This really is quite simple. The first file is the main prometheus.yaml file that the server starts from. Inside, make sure you have a job_name list item that points to the config file where the actual sensors are defined.
---
global:
scrape_configs:
- job_name: environment_sensors
  scrape_interval: 10s # this is quite frequent, but the data is so small it's not a big deal
  scrape_timeout: 9s
  file_sd_configs:
  - files:
- "/etc/prometheus/file_sd_config.d/targets/environment_sensors.yaml"Those sensors are simply written as below:
- targets:
- secondbedroom1-lon.iot.dmz.example.net:80 # you can use IP addresses if you don't want a DNS approach
- lounge1-lon.iot.dmz.example.net:80 # e.g. 192.168.0.205:80
- entrance1-lon.iot.dmz.example.net:80 # but remember, the IP might change if you don't reserve it in DHCP
- diningroom1-lon.iot.dmz.example.net:80
- mainbedroom1-lon.iot.dmz.example.net:80
- library1-lon.iot.dmz.example.net:80
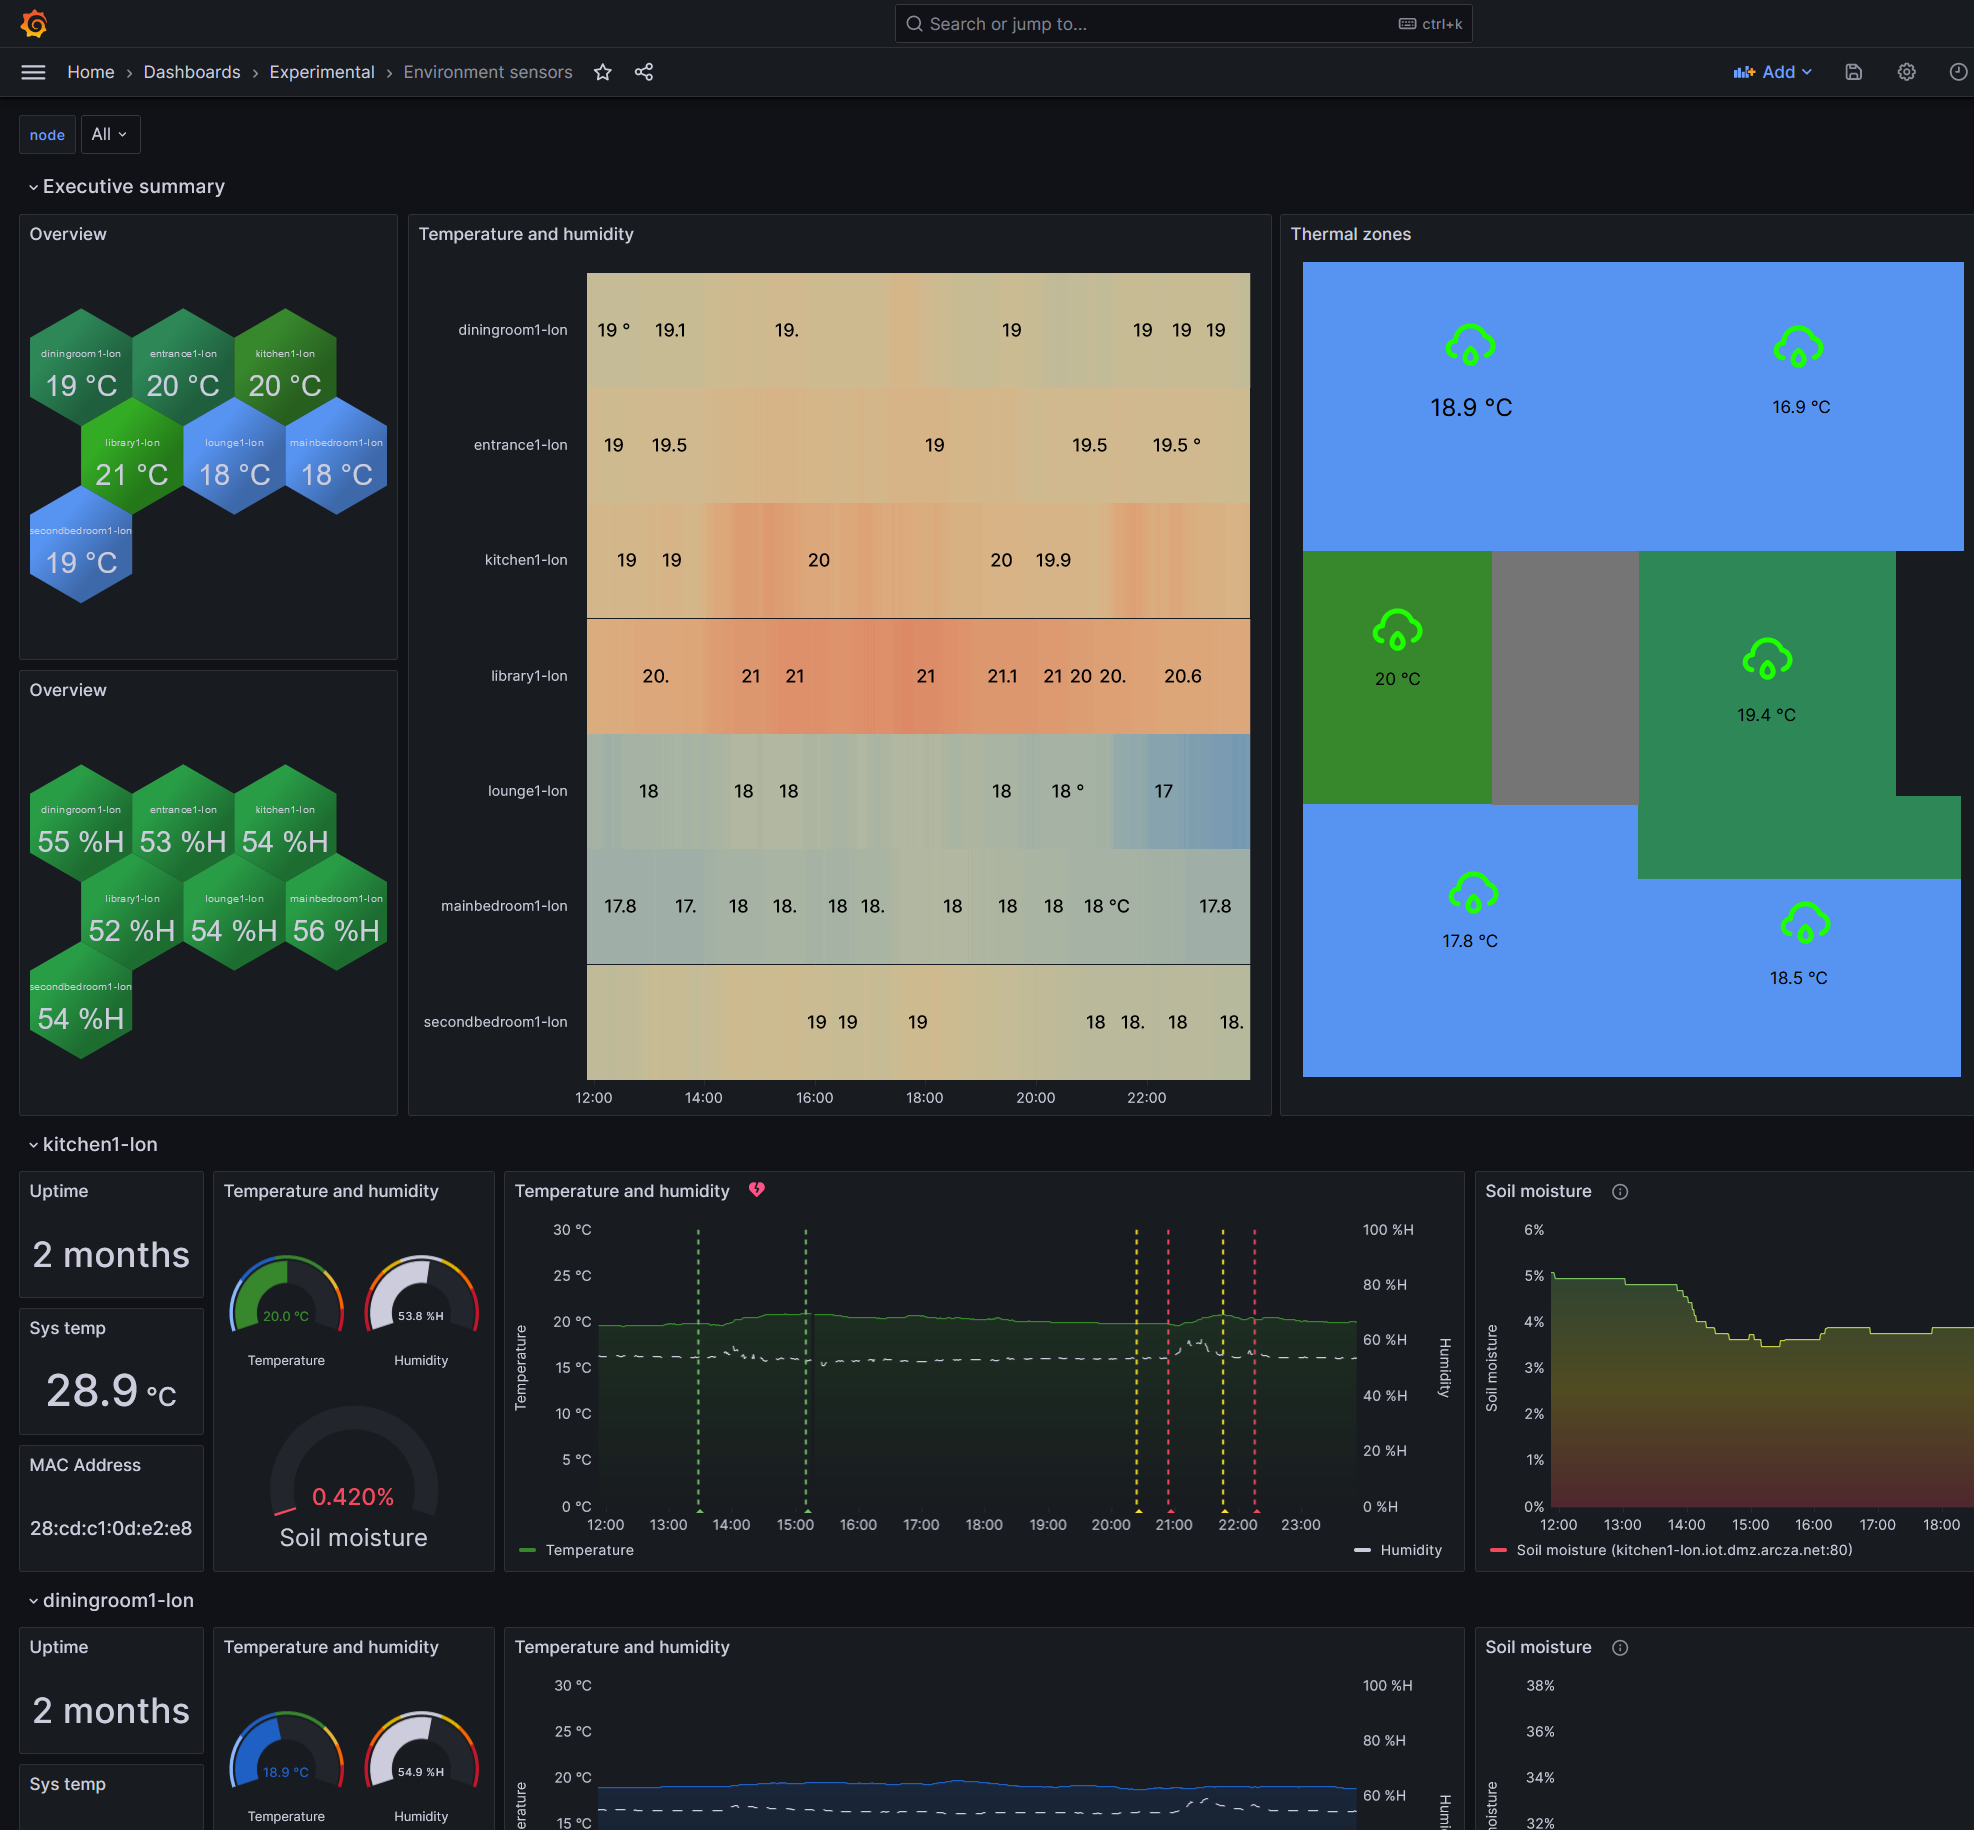
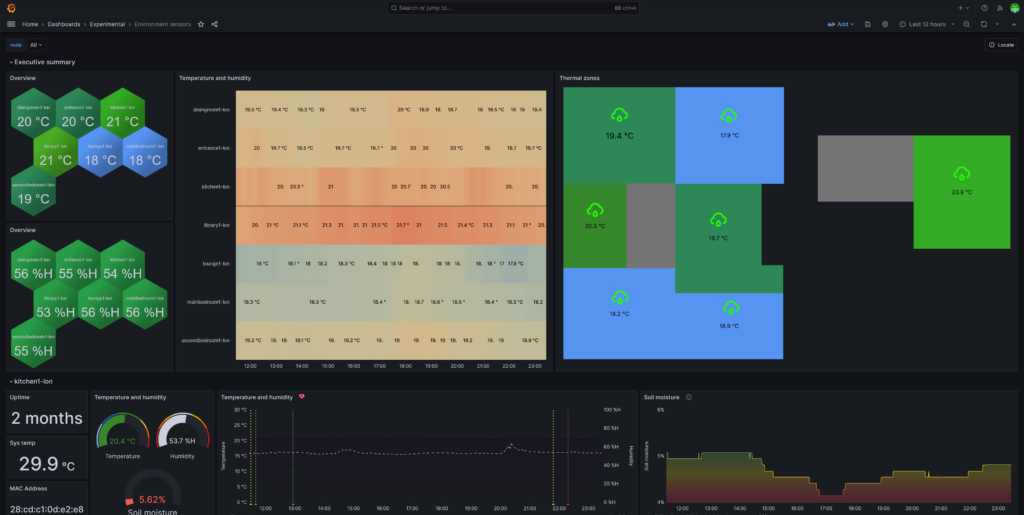
- kitchen1-lon.iot.dmz.example.net:80Part 7: Grafana dashboards
You can make your own, or import my dashboard (you can get dashboard.json here).
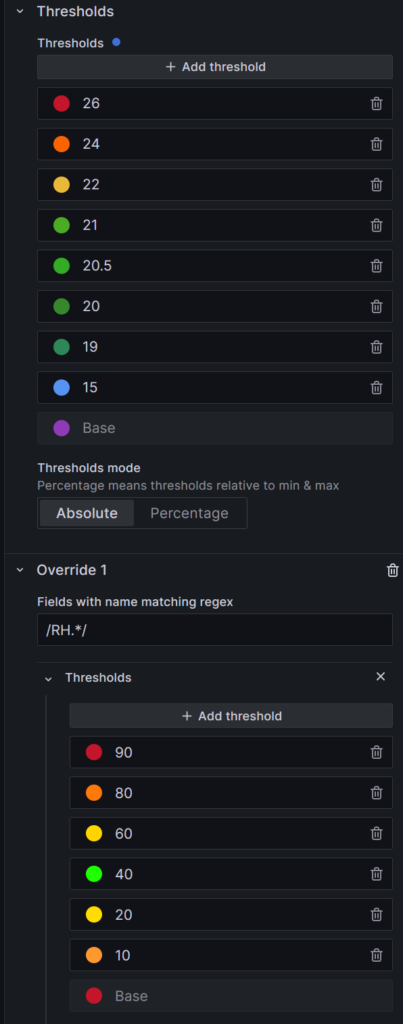
I overlaid the weather cloud with a colour depending on the humidity (e.g. 40-60% is green).
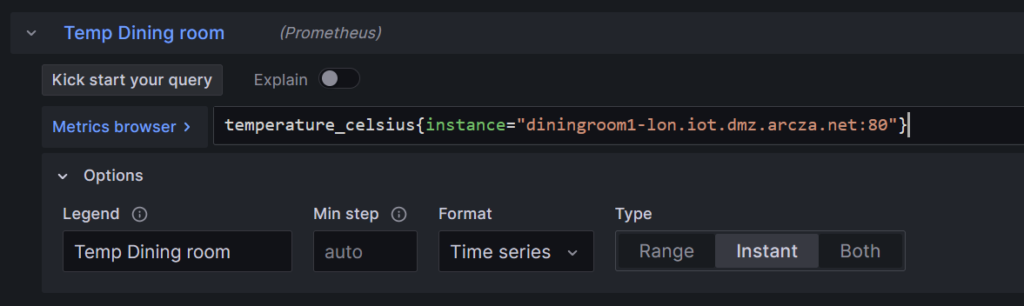
For each sensor, I used the Canvas plugin to make the map on the right hand side and had a corresponding query for temperature and humidity.
So for 7 sensors, there are 14 total queries. Sample temperature and humidity queries are below. It’s pretty simple:
temperature_celsius{instance="diningroom1-lon.iot.dmz.example.net:80"}humidity_percent{instance="diningroom1-lon.iot.dmz.example.net:80"}Part 8: Docker + Python + email for daily heatmap
Start with a simple Dockerfile:
# Use the official Python 3.11 alpine image as the base image
FROM python:3.11-alpine

# Set the working directory in the container
WORKDIR /app

# Copy the requirements file into the container at /app
COPY requirements.txt .

# Install any dependencies specified in requirements.txt
RUN pip install --no-cache-dir -r requirements.txt

# Install Firefox and geckodriver
RUN wget -O geckodriver.tar.gz https://github.com/mozilla/geckodriver/releases/download/v0.34.0/geckodriver-v0.34.0-linux64.tar.gz && \
    tar -xzf geckodriver.tar.gz -C /usr/local/bin/ && \
    chmod +x /usr/local/bin/geckodriver && \
    rm geckodriver.tar.gz

# Copy the local directory contents into the container at /app
COPY . .

CMD ["python", "./main.py"]We use the 3.11 Python Alpine base image and install stuff from a requirements.txt file:
selenium
apscheduler
requestsWe use:
seleniumto run Firefox in headless mode and grab a screenshot of the dashboardapschedulerto schedule the email sending logic at exactly 4pm every dayrequeststo cURL the Prometheus API to get avg temp/humidity in the subject line
Now for main.py where the actual logic takes place. This file:
- Takes a bunch of settings:
- mail config
- a Grafana dashboard public URL (public just means you can view it without logging in)
- a time to send the daily screenshot at
- a URL for Prometheus (to get the median temp/RH for the subject line)
- Sets up a “cron”-like job with
apschedulerwhich:- gets temp and RH from Prometheus
- sets up headless Firefox with Selenium to grab a screenshot
- attaches the screenshot to an email and sends it
- tidies up
import logging
import smtplib
import time
import os
from datetime import datetime
from email.mime.multipart import MIMEMultipart
from email.mime.text import MIMEText
from email.mime.image import MIMEImage
from typing import Union
import requests
from selenium import webdriver
from selenium.webdriver.firefox.options import Options
from selenium.webdriver.common.by import By
from apscheduler.schedulers.background import BackgroundScheduler
# Configuration: Email server
CLIMATE_SNAP_SENDER_EMAIL = "climatesnaps@example.com"
USERNAME="climatesnaps"
CLIMATE_SNAP_RECIPIENT_EMAIL = "climate-snaps-lon@example.com"
PASSWORD = "XXXXXXXX" # ideally this would be in Vault or similar
EMAIL_SERVER = 'smtp.example.net'
EMAIL_PORT = 587
# Configuration: Climate Snap email
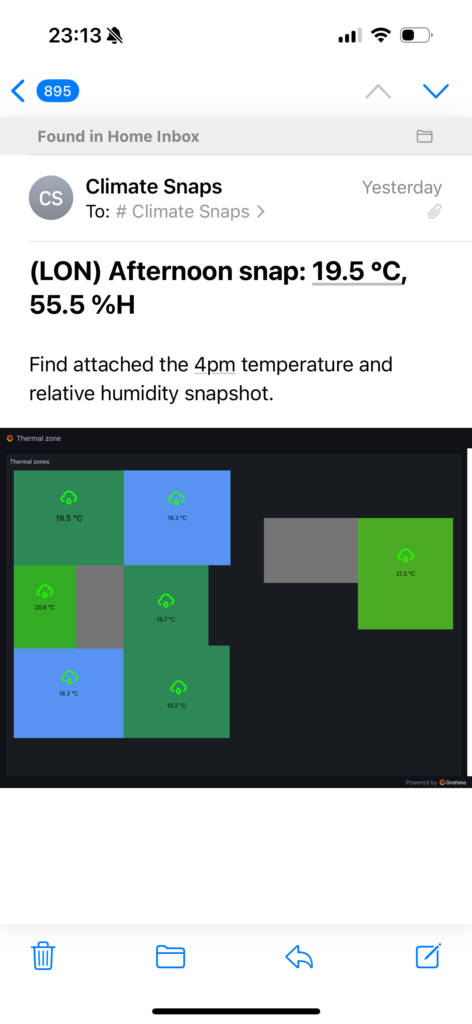
CLIMATE_SNAP_SUBJECT = "(LON) Afternoon snap: {temperature_celsius} °C, {humidity_percent} %H"
CLIMATE_SNAP_BODY = "Find attached the 4pm temperature and relative humidity snapshot."
CLIMATE_SNAP_HOUR = "16" # 4pm email
CLIMATE_SNAP_MINUTE = "0"
CLIMATE_SNAP_SECOND = "0"
CLIMATE_SNAP_TIMEZONE = "Europe/London"
# Configuration: Grafana
DASHBOARD_URL = "https://grafana.example.net/public-dashboards/5b2dc81fcbcf46a09cf0834a07472e22"
# Configuration: Prometheus
PROMETHEUS_BASE_URL = "https://prometheus.example.net"
PROM_QUERY_TEMPERATURE = 'quantile(0.5, temperature_celsius{job="environment_sensors"})'
PROM_QUERY_HUMIDITY = 'quantile(0.5, humidity_percent{job="environment_sensors"})'
# Configuration: Environment
FIREFOX_BINARY_PATH = "/usr/bin/firefox-esr"
def get_prometheus_reading(query: str) -> Union[float, None]:
'''
Gets a prometheus value from a query
Returns:
Union[float, None]: typically a float, or None if the query fails
'''
try:
return requests.get(PROMETHEUS_BASE_URL + '/api/v1/query',
params={'query': query}).json()
except requests.exceptions.SSLError:
logging.error("SSL/TLS error. Are you using a self-signed cert or custom CA? " +
" Make sure it's in the cert bundle included with the Docker image.")
def get_temperature_celsius() -> float:
'''
Gets the median temperature in degrees celsius from Prometheus
Returns:
float: temperature
'''
data_temperature_celsius = get_prometheus_reading(PROM_QUERY_TEMPERATURE)
metric_temperature_celsius = data_temperature_celsius['data']['result'][0]['value'][1]
return metric_temperature_celsius
def get_humidity_percent() -> float:
'''
Gets the median humidity in %RH from Prometheus
Returns:
float: relative humidity
'''
data_humidity_percent = get_prometheus_reading(PROM_QUERY_HUMIDITY)
metric_humidity_percent = data_humidity_percent['data']['result'][0]['value'][1]
return metric_humidity_percent
def tidyup(image_path) -> None:
'''
Deletes the screenshot image
Args:
image_path: path to the screenshot to delete
Returns:
None
'''
os.remove(image_path)
def afternoon_climate_snapshot_job() -> None:
'''
Job that apscheduler runs at 4pm, and includes all of the logic
Returns:
None
'''
# Get the current timestamp for the image name
today = datetime.now()
image_name = today.strftime("%Y-%m-%d %H:%M:%S")
# Get temp and RH
try:
temperature_celsius = get_temperature_celsius()
humidity_percent = get_humidity_percent()
except Exception:
logging.error("Critical error - failed to get temp and humidity from Prometheus")
# Get Firefox/Selenium ready
firefox_options = Options()
firefox_options.headless = True
firefox_options.add_argument("--window-size=1900,3200")
firefox_options.add_argument("--start-maximized")
firefox_options.add_argument("--headless") # Use headless mode for running in the background
firefox_options.binary_location = FIREFOX_BINARY_PATH
firefox_options.add_argument("--disable-gpu")
# Initialize the WebDriver
driver = webdriver.Firefox(options=firefox_options)
driver.maximize_window()
# Navigate to the public Grafana dashboard to grab
driver.get(DASHBOARD_URL)
# Wait for the dashboard to load, else you might get a blank panel
time.sleep(1)
# Set the window size to match the entire webpage
driver.set_window_size(1200, 1000)
# Find the full page element (usually 'body') and capture the screenshot
full_page = driver.find_element(By.TAG_NAME, "body")
full_page.screenshot(f"{image_name}.png")
# Close the browser window
driver.quit()
# Generate email to send
message = MIMEMultipart()
message['From'] = CLIMATE_SNAP_SENDER_EMAIL
message['To'] = CLIMATE_SNAP_RECIPIENT_EMAIL
try:
message['Subject'] = CLIMATE_SNAP_SUBJECT.format(
temperature_celsius=temperature_celsius,
humidity_percent=humidity_percent
)
body = CLIMATE_SNAP_BODY
except UnboundLocalError:
message['Subject'] = "Error generating climate snap temp/RH"
body = "Please check system logs in the Climate Snaps container. Is Prometheus healthy?"
logging.error("Failed to generate a normal Climate Snap email")
message.attach(MIMEText(body, 'plain'))
# Attach image
try:
image_path = f"{image_name}.png"
with open(image_path, 'rb') as attachment:
image_mime = MIMEImage(attachment.read(), _subtype="jpg")
image_mime.add_header('Content-Disposition', 'attachment',
filename=os.path.basename(image_path))
message.attach(image_mime)
except FileNotFoundError:
screenshot_error_message = "Failed to attach screenshot of heatmap."
message.attach(MIMEText(screenshot_error_message, 'plain'))
logging.error("Failed to attach heatmap screenshot - file not found")
# SMTP server setup
server = smtplib.SMTP(EMAIL_SERVER, EMAIL_PORT)
# Attempt to send the email, try 10 times before failing
for i in range(10):
try:
server.starttls()
server.login(USERNAME, PASSWORD)
server.sendmail(CLIMATE_SNAP_SENDER_EMAIL, CLIMATE_SNAP_RECIPIENT_EMAIL,
message.as_string())
server.close()
tidyup(image_path)
logging.info("Sent email to {recipient} with attachment {file}"
.format(recipient=CLIMATE_SNAP_RECIPIENT_EMAIL, file=image_path))
break
except smtplib.SMTPException:
logging.error("Failed to send email message to {recipient}"
.format(recipient=CLIMATE_SNAP_RECIPIENT_EMAIL))
time.sleep(10) # wait 10 sec and try again, up to 10 times
i+=1
if __name__ == '__main__':
try:
scheduler = BackgroundScheduler(timezone=CLIMATE_SNAP_TIMEZONE)
scheduler.add_job(afternoon_climate_snapshot_job, 'cron',
hour=CLIMATE_SNAP_HOUR,
minute=CLIMATE_SNAP_MINUTE,
second=CLIMATE_SNAP_SECOND)
scheduler.start()
except Exception as e:
logging.error("An exception was raised when starting the Climate Snaps main job: " + e)
try:
# Keeps the main thread alive
while True:
time.sleep(2)
except (KeyboardInterrupt, SystemExit):
scheduler.shutdown()
To get this deployable, you’ll need to build it with Docker:
docker build . -t home-climateYou can now run this in Docker:
docker run -d home-climateor you can docker push somewhere and deploy it to Kubernetes with a deployment:
apiVersion: apps/v1
kind: Deployment
metadata:
  name: home-climate
  namespace: abc
spec:
  selector:
    matchLabels:
      run: home-climate
  replicas: 1
  template:
    metadata:
      labels:
        run: home-climate
    spec:
      containers:
      - name: home-climate
        image: registry.core.example.net/abc/home-climate:latest
      imagePullSecrets:
      - name: abc-registry
I’m self-hosting a Docker registry above and have a secret called abc-registry to authenticate to it. Simply run kubectl apply -f deployment.yaml to deploy.
Part 9 (optional): Grafana alerts
It’s pretty easy to set up a few Grafana alerts:
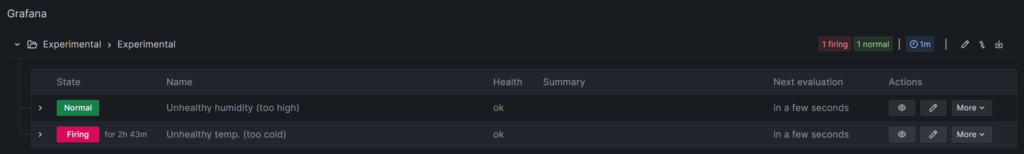
For example, here is the logic for the Unhealthy temp. (too cold) alert that warns me if a room is below 18° C for over 1hr:
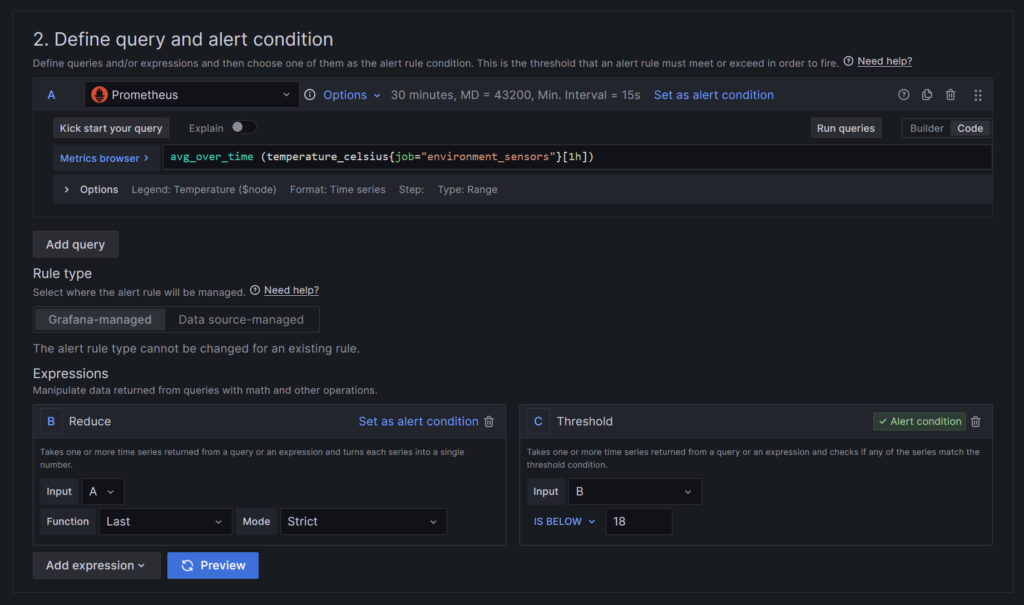
That’ll have a corresponding contact point which will email me the alert, providing SMTP is set up in Grafana.
Part 10: verify
It’s 4pm and I get a Climate Snap, consistently:
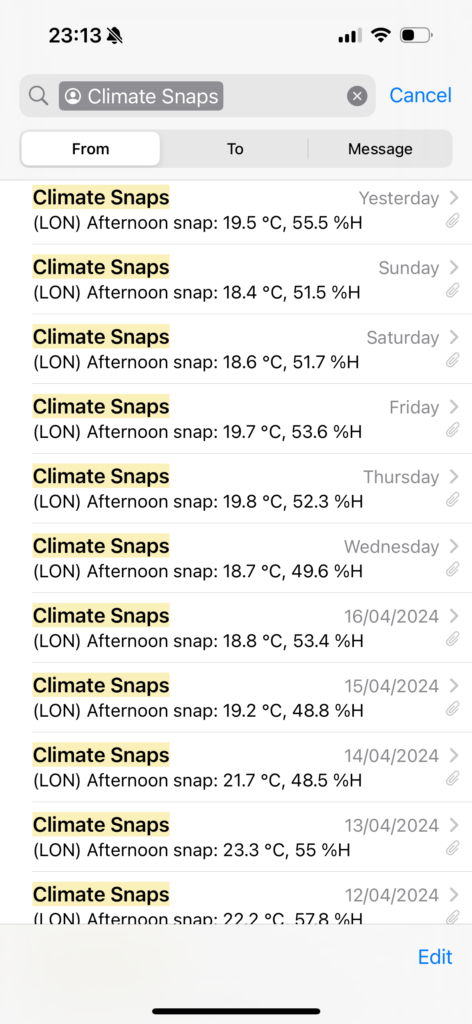
I also get regular alerts from Grafana via email when temperature is too low, or humidity is too high.
Closing thoughts
Is this profitable (versus buying already-made sensors)?
Yes, when you add soil measurement functionality. Temp/humidity alone would have been cheaper to buy on Amazon, but having both in one would cost about £40 online, versus my marginal cost of £25. Labour costs of my time is not accounted for.
What was the biggest pain point?
Soldering only one red wire and then undoing it when I needed to add the second sensor’s wire. I don’t have a desoldering tool and nearly damaged one board. I didn’t damage any Picos in this process though.